-
According to author, Jaysen Rand, there have been two significant axis shifts of the earth in the last 20 years. The shifts in question were a 2,000 mile shift. We don't notice this because the earth rotates at about 1038 MPH anyway and rotates 25,000 miles every day.
- So if we don't feel those speeds & distances; we also would not feel a "measly" 2000 mile shift. However...Mother Nature does feel it...and gives a little "shrug" which we humans experience as a 10 - 20 degree F. difference in our climate.
- Jaysen Rand believes that this Earth Shift is the reason we have such bizarre climate changes at this time.
- He also believes that the reason for the Earth Shift is the return of Planet "X"; the Sumerian "Planet of the Crossing" or "Nibiru". And this could also coincide with the 2012 date of the end of the Mayan Calendar
|
| 2006: Earth-Shift 1 and EarthShift 2 |
EARTH
SHIFT #2 allegedly occurred on
6
December 2006 at 19:15 UT
- Once again,
look at the upper right hand corner
- At the same
time of the discrepancy; all GPS was knocked out.
- Later the
loss of all global GPS satellite systems was said to be due to a Solar
Flare...only problem is...there is no record of Solar Flares at that
same time...and almost all the SOHO Solar Data for those times
is....missing.
↓
| EARTH SHIFT #1 allegedly occurred
on
4 December 2006 at 12:30 UT
- In the Upper
Right Hand Corner (see below) the Shift can be seen as...the Outline
shows where the Earth perimeter was a split second ago before the Shift
↓
|
 |
| Click Image To Enlarge: Still of EarthShift "2": 6 Dec 2006 19:15:06 Zulu |
|
|
 |
| Click Image To Enlarge: Still of EarthShift "1": 04 Dec 2006 12:30 Zulu |
|
|
 |
| EarthShift "2" - Click Image To Enlarge |
|
|
 |
| EarthShift "1" - Click Image To Enlarge |
|
|
|
THE DISAPPEARING SOLAR FLARE ???
|
|
Jaysen Rand Poses These Questions:
- Why did NASA & NOAA declare that a historic solar flare trashed the entire GPS satellite system, yet they have no images of the flare before the outage? All of the images of the sun have been deleted from the NASA, ESA & SOHO files.
- Consider all of the data, evidence & images as a whole; and read further about the GPS system failure and the elusive solar flare that ate it. (See Below)
- From the evidence so far, it appears the change to the earth's axis occurred in several smaller axis shifts, rather than all at once.
- The most significant shifts appear to be on Dec 4th and Dec 6th of 2006 ... and this was also the period of time during which the GPS system failed across the globe.
|
BUT IS IT REAL?
- An exceptionally active solar region (930) rotated onto the solar disk at a time when solar cycle 23 was theoretically approaching minimum levels.
- On December 5th 2006 at 10:18 UT region 930 generated an X9 flare that can be seen in both the sequence of GOES-13 SXI images and in the plot of GOES Space Environment Monitor data. Region 930 continued to generate flares over the ensuing two weeks and resultant ion storms were also recorded by GOES. One such storm had sufficient energy to be recorded at ground level by neutron monitoring stations.
- GOES 13 SXI sustained damage to several pixels of its detector while observing this X9 flare event. The source of the damage was the large X-ray flux of the flare convolved with the observing sequence. At the time, the susceptibility of the detector to radiation damage was not well understood or constrained.
The type of damage affects 8 lines of pixels across the CCD and is unlikely to recover. Operational constraints and updates to on-board observing sequence software will enable the SXI to continue its mission without further damage to its detector.
The impact on observations and prediction is currently being assessed as the new sequence software and operational constraints are developed. In addition, ground alogrithms will be developed to minimize the appearance of the 'lost' lines through interpolation or other means.
|
 |
| Click Image To Enlarge: "Solar Minimum Flare" That NOAA says is the real reason for the "jump" on Satellite purporting to Show An Axial Shift |
|
|
- The chart below is the actual data of solar emissions, including the date which NOAA claimed a historical solar Flare occurred on Dec 5, 2006 from 10:18 UT to 10:45 UT. If you go and look at the actual readings of solar emissions and activities and images of the sun for that specific time and date... almost all of the data & images are missing. Of the few data sources they overlooked and forgot to delete... none of the data supports NOAA's claim.
- On the chart below you can clearly see that there is no increase in emissions on Dec 5th, 2006 between 10:18 UT and 10:45 UT.
- This chart shows the solar emission data chart between Nov 14, 2006 and Dec 12, 2006. You can clearly see that the readings for Dec 4-6 are in line with readings in November and later in December. In fact, many other dates shown on this chart are much higher than the Dec 5 & 6, 2006 dates they falsely claimed had a historic solar flare which knocked down the GPS system.
Any readings with -1 means that the data was not received or read for those dates and times. It is an auto-generated numeral for missing data.
SOHO CELIAS Proton Monitor
Solar Wind Parameters for Carrington Rotation 2050 (hour averages)
06 DEC 5 339:09:00:00 -1 -1.0 -1 99.0 192.9 10.9 16.4 146.2 0.4 90.4
06 DEC 5 339:10:00:00 -1 -1.0 -1 99.0 192.9 11.1 16.4 146.2 0.4 89.8
06 DEC 5 339:11:00:00 -1 -1.0 -1 99.0 192.9 11.2 16.4 146.2 0.4 89.3
06 DEC 5 339:12:00:00 -1 -1.0 -1 99.0 192.9 11.4 16.4 146.2 0.4 88.7
06 DEC 5 339:13:00:00 -1 -1.0 -1 99.0 192.9 11.6 16.4 146.2 0.4 88.2
06 DEC 5 339:14:00:00 -1 -1.0 -1 99.0 192.9 11.7 16.4 146.2 0.4 87.6
06 DEC 5 339:15:00:00 -1 -1.0 -1 99.0 192.9 11.9 16.4 146.2 0.4 87.1
|
M
O
R
E
O
F
W
H
A
T
I
S
J
U
S
T
N
O
T
T
H
E
R
E
I
N
D
E
C
O
F
2
0
0
6
| SOLAR FLARE OF 5 DEC 2006:
SOME OF WHAT JAYSEN RAND FOUND TO BE "MISSING":
[1] - SOHO Lasco C2 Images for Dec 1 - 11 2006
- On the dates of the so-called historic flare, the images are all curiously missing. There are no images for Dec 4th or 5th and for Dec 6th, the images are only available after 2000 hours Zulu. For such a historic event as they claim the Dec 5, 2006 10:15 -10:45 UTC flare to have been, it seems very odd that all of the images are missing for those specific dates.
- Multiple images are taken each day by SOHO. Usually once or more times each hour but these are all the images available for these dates. Images on the important dates and times are missing.
- The images for 12/4 and 12/5 2006 are missing in entirety. The images on 12/6 are only available after 20:36 Zulu. 2 hours after the event ended. For a supposed historic flare which they claim damaged the GPS system, it is unbelievable that those very images would be missing.
[2] - SOHO MDI Magnetogram Images for Dec 1 - 31 2006
- These are the SOHO MDI Magnetogram images of the sun for 2006. There are no images for Dec 1-3; no images for Dec 5-11; no images for Dec 16, 19, 20, 25, 29 or 30. Again, this is more than a conspicuous absence of solar images during the supposed historical solar flare on Dec 5 & 6. In each instance those dates are missing.
[3] - SOHO MDI Continuum Images for Nov 15, 2006 - Jan 15, 2007
- These are the SOHO MDI Continuum images of the sun. There are no images for Nov 15, 16, 17, 19, 20, 21, 23; no images for Nov 25 thru Dec 10; no images for Dec 12, 14, 16, 17, 18, 20; no images for Dec 22 thru Dec 26; no images for Dec 28, 30; no images for Jan 1, 3, 4, 6, 9, 14, 15.
- Again, this is more than a conspicuous absence of solar images during the supposed historical solar flare on Dec 5 & 6. In each instance those dates are missing.
[4] - The SOHO EIT 195 images of the sun for 2006.
- These are heavily filtered images of the surface of the sun. As with all the others. there are no images for Dec 1-12, 2006. But they had plenty of images for other dates. For Dec 13 and 14, shown below, there are 16 images for each date. Again, this is more than a conspicuous absence of solar images during the supposed historical solar flare on Dec 5 & 6. In each instance the images for those dates are missing.
[5] - SOHO EIT 304 Images for Dec 1 - 15 2006
- These are the SOHO EIT 304 images of the sun for 2006. These are heavily filtered images of the surface of the sun. As with all the others. there are no images for Dec 1-13, 2006. Again, this is more than a conspicuous absence of solar images during the supposed historical solar flare on Dec 5 & 6. In each instance the images for those dates are missing.
[6] - OTHER INSTANCES OF "COVERING UP"?
- [A] - (yellow image below) The Blocking a small patch on the surface of the sun for Dec 15 at 07:06 zulu. The only reason to insert a patch is to hide something they do not want the public to see. This has been done on a variety of images.
- [B] - (blue image below) Shows purposely blocked off most of the image and even went to the trouble to add a second small "patch". "Someone" does this anytime they don't want the public to see something, but; you can see the streak coming in from the lower left. A streak caused by a moving object which "they" did not want you to see.
- BIG NOTE: According to Jaysen Rand ... the lack of any images for this period clearly would appear to substantiate that the Dec. 5th, 2006 "historic" flare was nothing more than a cover story... for what really affected Satellite Views and GPS functioning.
[ The records in question are from:
SOHO (a NASA - ESA Solar monitoring entity), SEC-NOAA (under the Dept of Commerce) ]
|
 |
| Click To Enlarge: Sun - 15 Dec 2006 |
|
|
 |
| Click To Enlarge: Sun - 13 Dec 2006 |
|
|
|
Which Way Did The Earth Tilt?
|
|
| The Images below are from : divulgence.net by Jaysen Rand |
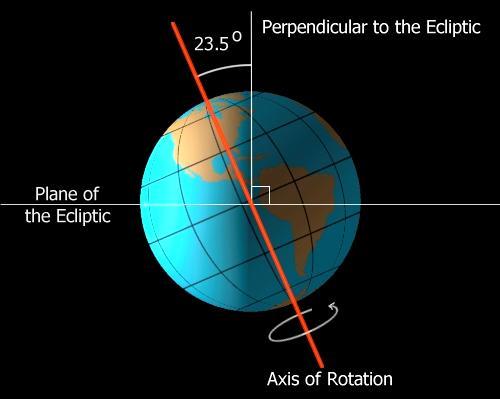 |
| This Image shows the Earth's normal tilt on its Axis - 23 1/2 Degrees |
|
|
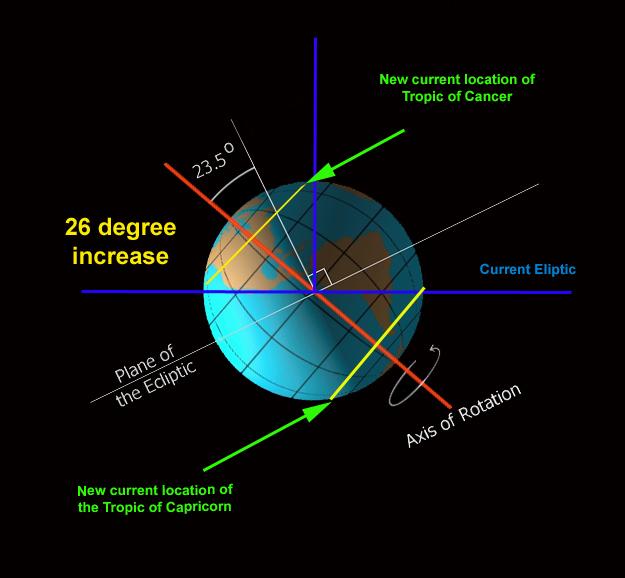 |
| The Supposed New & Current tilt of the Earth's Axis at 49 1/2 degrees (approx.) |
|
|
- On Planet Earth...as the Seasons pass, the Sun will be at Zenith only as far North as the Tropic of Cancer [June 21st - the Summer Solstice / Cancer Ingress] and only as far South as the Tropic of Capricorn [Winter Solstice - Capricorn Ingress]
- Our Seasons consist of the 2 Solstices [Summer & Winter] and the 2 Equinoxes [Vernal or Spring & Autumnal]
Astrologically we refer to the the Seasons thusly:
- Vernal Equinox = Aries Ingress
- Autumnal Equinox = Libra Ingress
- Summer Solstice = Cancer Ingress
- Winter Solstice = Capricorn Ingress
|
- Normally, the Tropic of Cancer runs through the middle of Mexico...with the Sun at its Zenith on June 21st
- Now...according to Jaysen Rand...the Tropic of Cancer runs through North & South Dakota
|
- Normally, The Tropic of Capricorn runs through Brazil...with the Sun at its Zenith on Dec. 21st.
- Now...according to Jaysen Rand...the Tropic of Capricorn runs through the tip of South America.
- The Vernal Equinox & the Autumnal Equinox would show no change
- The Sun will still be directly over the Equator at those times.
|
|
POSSIBLE AXIS - TILT CHARTS
|
|
 |
| Click Image To Enlarge |
|
|
- In the Dial to the Left,
at 62� 16', is for the formula for "Planets":
Neptune + Kronos - Admetos
- At 74� 39' is a placeholder for the formula for the Planet Earth Itself
- As a Result; the Planet Earth = the Sun & is Semi-Octile the Moon.
|
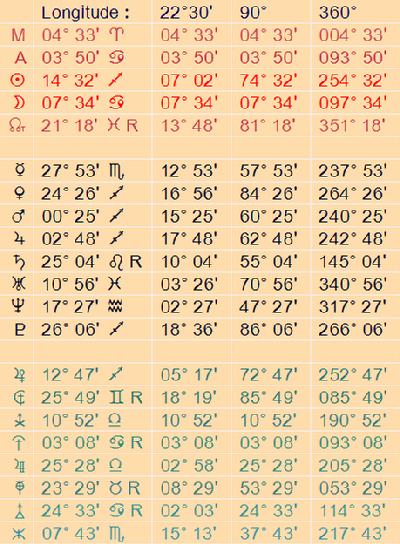
To the Right
→
are the
Planetary Positions
in 4 formats
for the Earth Shift-2
World Chart
|
 |
| Click Image to Enlarge |
|
|
| Below Are Dial Charts of the 2nd Earth-Shift Event |
 |
| Click Image to Enlarge |
|
| This is the World Chart at the time of the Axis Shift.
Does the chart reflect such a shift?
The following is what the Chart Shows:
- The Star in the Dial on the left is a placeholder for the formula:
Admetos/Poseidon + Aries/Pluto - Node = 74� 41' = the Sun
- In a Mundane World chart for the Planet Earth itself; the meaning would be as follows:
"The Subtle Atmosphere or Climate" - and "a Major Change in Daily Acitivity" - are "Connected" - to the Sun or the "body of the Earth".
|
|
| Click Image to Enlarge |
|
|
- But, in this Chart, the Sun does not act alone. Now, in the Dial on the left;
the Blue Star is a placeholder for the Sun / Moon Midpoint.
- This Midpoint clearly equals Pluto-Hades on the Dial
- Taken together, this combination indicates: Sun / Moon = Pluto / Hades
"At this time, there develops a Decline or "Downfall" (a tilt or falling over?)
|
- Now, in the dial on the right; the formula: (Aries + Sun ) + (Sun + Admetos) - (Sun/Mars) = 45� 05'which combination means:
"The Earth's body, its Heaviness & Weight is Disrupted
- And as it just so happens, the Sun/Mars Midpoint = 67� 28'...so:
"the Earth's body, its heaviness & weight is disrupted in its "daily activity".
- In addition, the Aries/Admetos Midpoint at 26� 45' equals the Midheaven/Ascendant Midpoint at 04� 12'. This pattern indicates:
The "Resource" of this Chart (the Earth) experiences "a Turnover or a Rotation"
- This Event Chart also has the Midpoint of
[Aries/Admetos + the Midpoint of Pluto/Poseidon] equalling the Midpoint
of (Jupter/Vulcanus), thus Indicating:
"A Turnover" (or Rotation) of
Orientation is "Mightily or Forcefully Successful"
|
 |
| Click Image to Enlarge |
|
|
|
" Earth's Lost Atmosphere"
|
|
 |
| Click Image To Enlarge: Earth's Atmosphere Being Blown Into Space |
|
|
|
24th
thru
25th
S
e
p
t
e
m
b
e
r
1
9
9
8
|
|
|
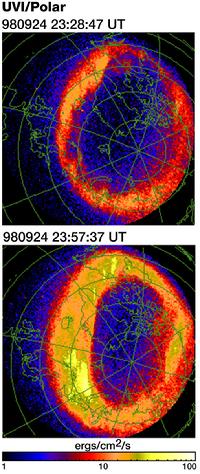
- Earth's Aurora as seen by Polar UVI Instrument - After The Ultraviolet Imager on NASA's Polar spacecraft captured this view of the aurora as seen from space on September 24-25, 1998. Auroras are typically seen from the ground only at night, but they in fact spread around the day and night side of Earth's north and south poles. Viewing the auroral oval in ultraviolet light allowed researchers to confirm intense activity on the day side of Earth, where the plasma from the ionosphere was squeezed out into space. CREDIT: NASA Marshall Space Flight Center
|
 |
| Click Image to Enlarge |
|
|
- In the Dial on the left, with the pointer on Kronos at 03� 08'; we can see the pattern of Uranus / Apollon = Neptune/Asc ; thus is indicated:
"There is a "Great Tension" that "Runs - Out"
- With Uranus / Apollon = Neptune / Asc = Kronos:
"The Air and /or the Great Tension it is Under, Expands or Runs-Out ."
(The Air under great tension is the Earth's Atmosphere)
- This is a very important finding, as A NASA article for October 1998 stated that "A Solar Wind blew away some of Earth's Atmosphere".
Did this happen again, when the Earth "tilted'?
|
|